Operational Finance : Finance for Managers, Certification link.
1. Financial Analysis
- Operational Finance focuses on the daily activities driving a business forward.
- a model of financial analysis and diagnosis, using financial forecasts, and designing an action plan when needed.
- Corporate (or Structural) Finance : studies how to finance the fixed assets, and also the combination of debt and equity that a company should have.
- Strategic Finance: focus on developing comprehensive financial plans for their companies
Case Study : Ask credit from a bank (Credit (short term) and Loan (long term)).
1.1 Business Analysis
What are you doing? Business analysis to build expectation.
- Sales:
- What? Where? Economic condition.
- Cyclicality - fit with the economic cycle (e.g. car industry).
- Seasonality (e.g. ice-cream).
- Clients / Suppliers.
- Strategy (why am I good to my clients?): cheap, good, variety.
- Management team - trust.
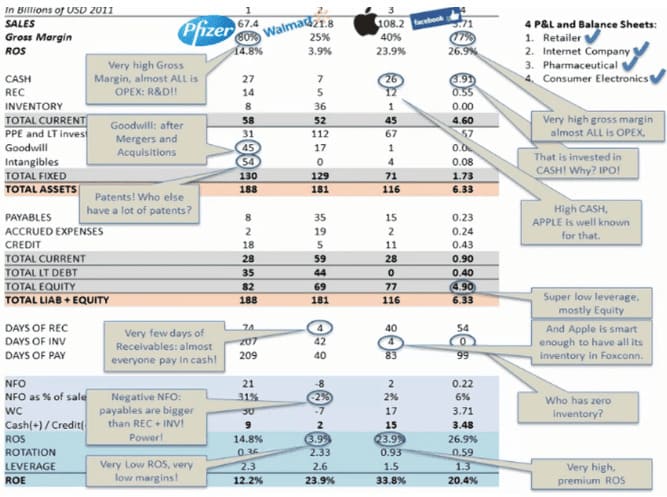
1.2 P&L Analysis
Do you make money?
- Sales: value and growth. Growth could be large for startup.
- Gross Margin & COGS (costs of good sold) : percentage of sales.
- OPEX (operational expense) : electricity, salaries, overhead.
- Operating profit / Sales.
- EBITDA / Sales.
- Financial Results (~2.5% EBIT).
Operational Risks vs. Financial Risks (interest expenses with stable income).
1.3 Balance Sheet Analysis
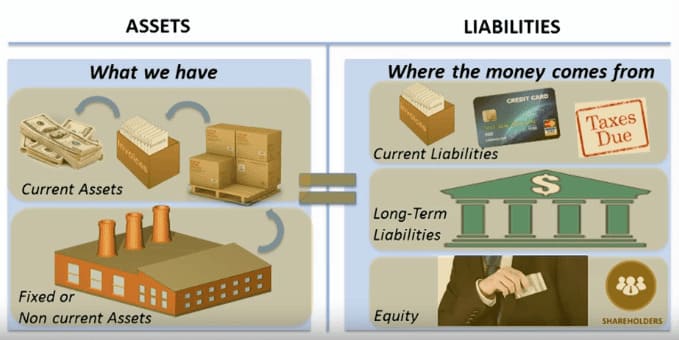
Do you need money?
- Look at the big numbers.
- Look at the evolution over the years.
- Look at the operational ratios.
2. Operational Ratios and Forecasting
2.1 Operational ratios
Days of Collection: (for receivables) the number of days the customers take to pay.
- $Days\ of\ Collection = \frac{RECEIVABLES}{Daily\ Sales}$ (“Daily Sales” is sales per day)
- Impact (of customer pay delay): $Extra\ Money\ Needed = Days\ Delay * Daily\ Sales$
Days of Inventory: the number of days I take to sell the inventory.
- $Days\ of\ Inventory = \frac{INVENTORY}{Daily\ COGS}$
- Impact (of excess inventory) : $Extra\ Money\ Needed = Days\ More * Daily\ COGS$
- “Turns Over” = inverse of “Days of Inventory”
Days of Payment (to suppliers) : the number of days I take to pay the suppliers.
- $Days\ of\ Payment = \frac{PAYABLE}{Daily\ PURCHASES}$
- $Stock\ Initial + Purchases - COGS = Final\ Stock$, $Purchases \approx COGS$
- Impact: $Extra\ Money\ Free = Days\ Delay * Daily\ PURCHASES$
Takeaways:
- The evolution tell if the company is well managed.
- look at the consequences in the balance sheet: longer collection, inventory or payment.
- top management usually believes that the condition (collection, inventory, payment) is better than it really is.
2.2 Forecast
Forecast P&L - Forecast Sales, then others.
Forecast Balance Sheet, derived from sales. Put cash and credit at the end. If total assets > (total liabilities + equity) , the difference will go to credit.
3. Diagnosis and Action Plan
3.1 Diagnosis
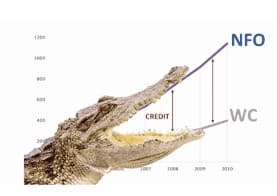
Diagnosis: Why do they need more and more credit? Structure problem : as company grow, the need of funds to operate grows faster than the working capital.
Need of Funds (NFOs) are funds required to finance a company's operations.
- Sources of needness for money : Delay in selling what you buy from suppliers - receivables and inventory.
- NFO = RECEIVABLES + INVENTORY - PAYABLES (directly related to sales)
- NFOs are "use of assets".
Working Capital (WC) is the long-term funding available to finance the NFO once the fixed assets have been financed.
- WC = EQUITY + LONG-TERM DEBT - FIXED ASSETS or WC = Current Assets - Current Liabilities
- WC is "source of funds".
- if NFO < WC, we have extra CASH.
- id NFO > WC, we need to ask for CREDIT.
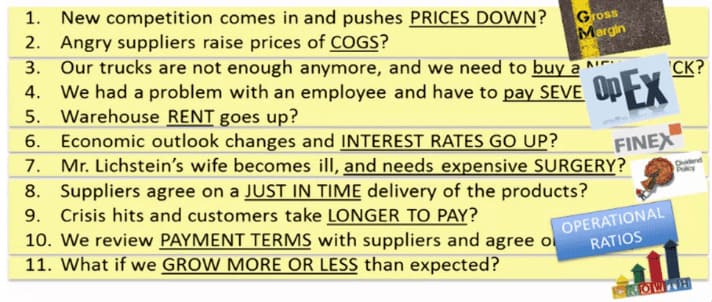
3.2 Action Plan
Plan to solve the problem drawn from diagnosis.
- NFO : Changing REC, INV, PAY.
- WC: Changing LT Debt, FA, or Equity. We could work on P&L (making money).
Sustainable Growth : WC should grow faster or equal to NFO. $\Delta NFO <= \Delta WC$
- $\Delta NFO_{t} = NFO_{t}^{\%} * \Delta Sales_{t}$ (assuming NFO per sale is constant)
- $\Delta WC_{t} = \frac{Net\ Income_{t}}{Sales_{t}} * Sales_{t} = ROS_{t} * (Sales_{t -1} + \Delta Sales_{t})$ (with Return on Sales,ROS)
- As a result , $\frac{NFO_{t}^{\%} * \Delta Sales_{t}}{Sales_{t -1}} = \frac{ROS_{t} * (Sales_{t -1} + \Delta Sales_{t})}{Sales_{t -1}}$
- We have $NFO_{t}^{\%} * g = ROS_{t} * (1 +g)$
- We have $g = \frac{ROS_{t}}{NFO_{t}^{\%} - ROS_{t}}$
4. Sensitivity Analysis, NFO Revisited, and ROE
Sensitivity Analysis, how sensitive the results are if the key variables changed.
Seasonal Companies
Return On Equity ROE, more interesting for shareholders.
\[ROS = \frac{Net\ Income}{Salse} \frac{Sales}{Assets} \frac{Assets}{Equity} = ROS * Turnover * Leverage = \frac{Net\ Income}{Equity}\]Blind Financial Statements